Blog
The Earth Observation Blog
Landsat and the Spain summer 2012 wildfires (II)
Some weeks ago I wrote about the uses of Landsat data in the evaluation of fire burns and how to process the pre-fire and post-fire images by using the Normalized Burn Ratio $(NBR)$. An initial assessment of one of the major Spanish fires of the summer 2012 was carried out, showing a classification of the initial fire severity. However, it was already pointed out that an extended assessment is usually done by comparing two images during the growing season, the year of the fire and the year after. This allows for vegetation trends to establish after the fire, showing either a recovery or green vegetation deaths in the next growing season. Extended assessments are useful in obtaining a final picture of the fire summarizing the short-term burn effects and evaluating the long-term ecological impact to species.
In the previous post two passes with dates 9th August 2011 and 11th August 2012 were selected as the pre-fire and post-fire images, respectively, for the initial assessment of the burn (the fire was considered extinguished the 30th June 2012). For the extended assessment a pre-fire image the 23rd May 2012 has been selected. Choosing a Landsat pass around the same period one year after as the post-fire image was not very convenient due to the extended winter and heavy rains in 2013. As a result, an image taken the 27th June 2013 seemed characteristic of the growing season and comparable to the one the year before.
Both images were processed in false color assigning bands 7 (short-wave infrared), 4 (near-infrared) and 2 (green) to the R-G-B channels, respectively (according to Landsat 7 bands ordering). The burn locations of interest are marked with B1 (main fire near La Jonquera), B2 (secondary fire in Portbou), and B3 (an old 2006 fire near Sant Climent Sescebes), with the main fire under analysis being the former.
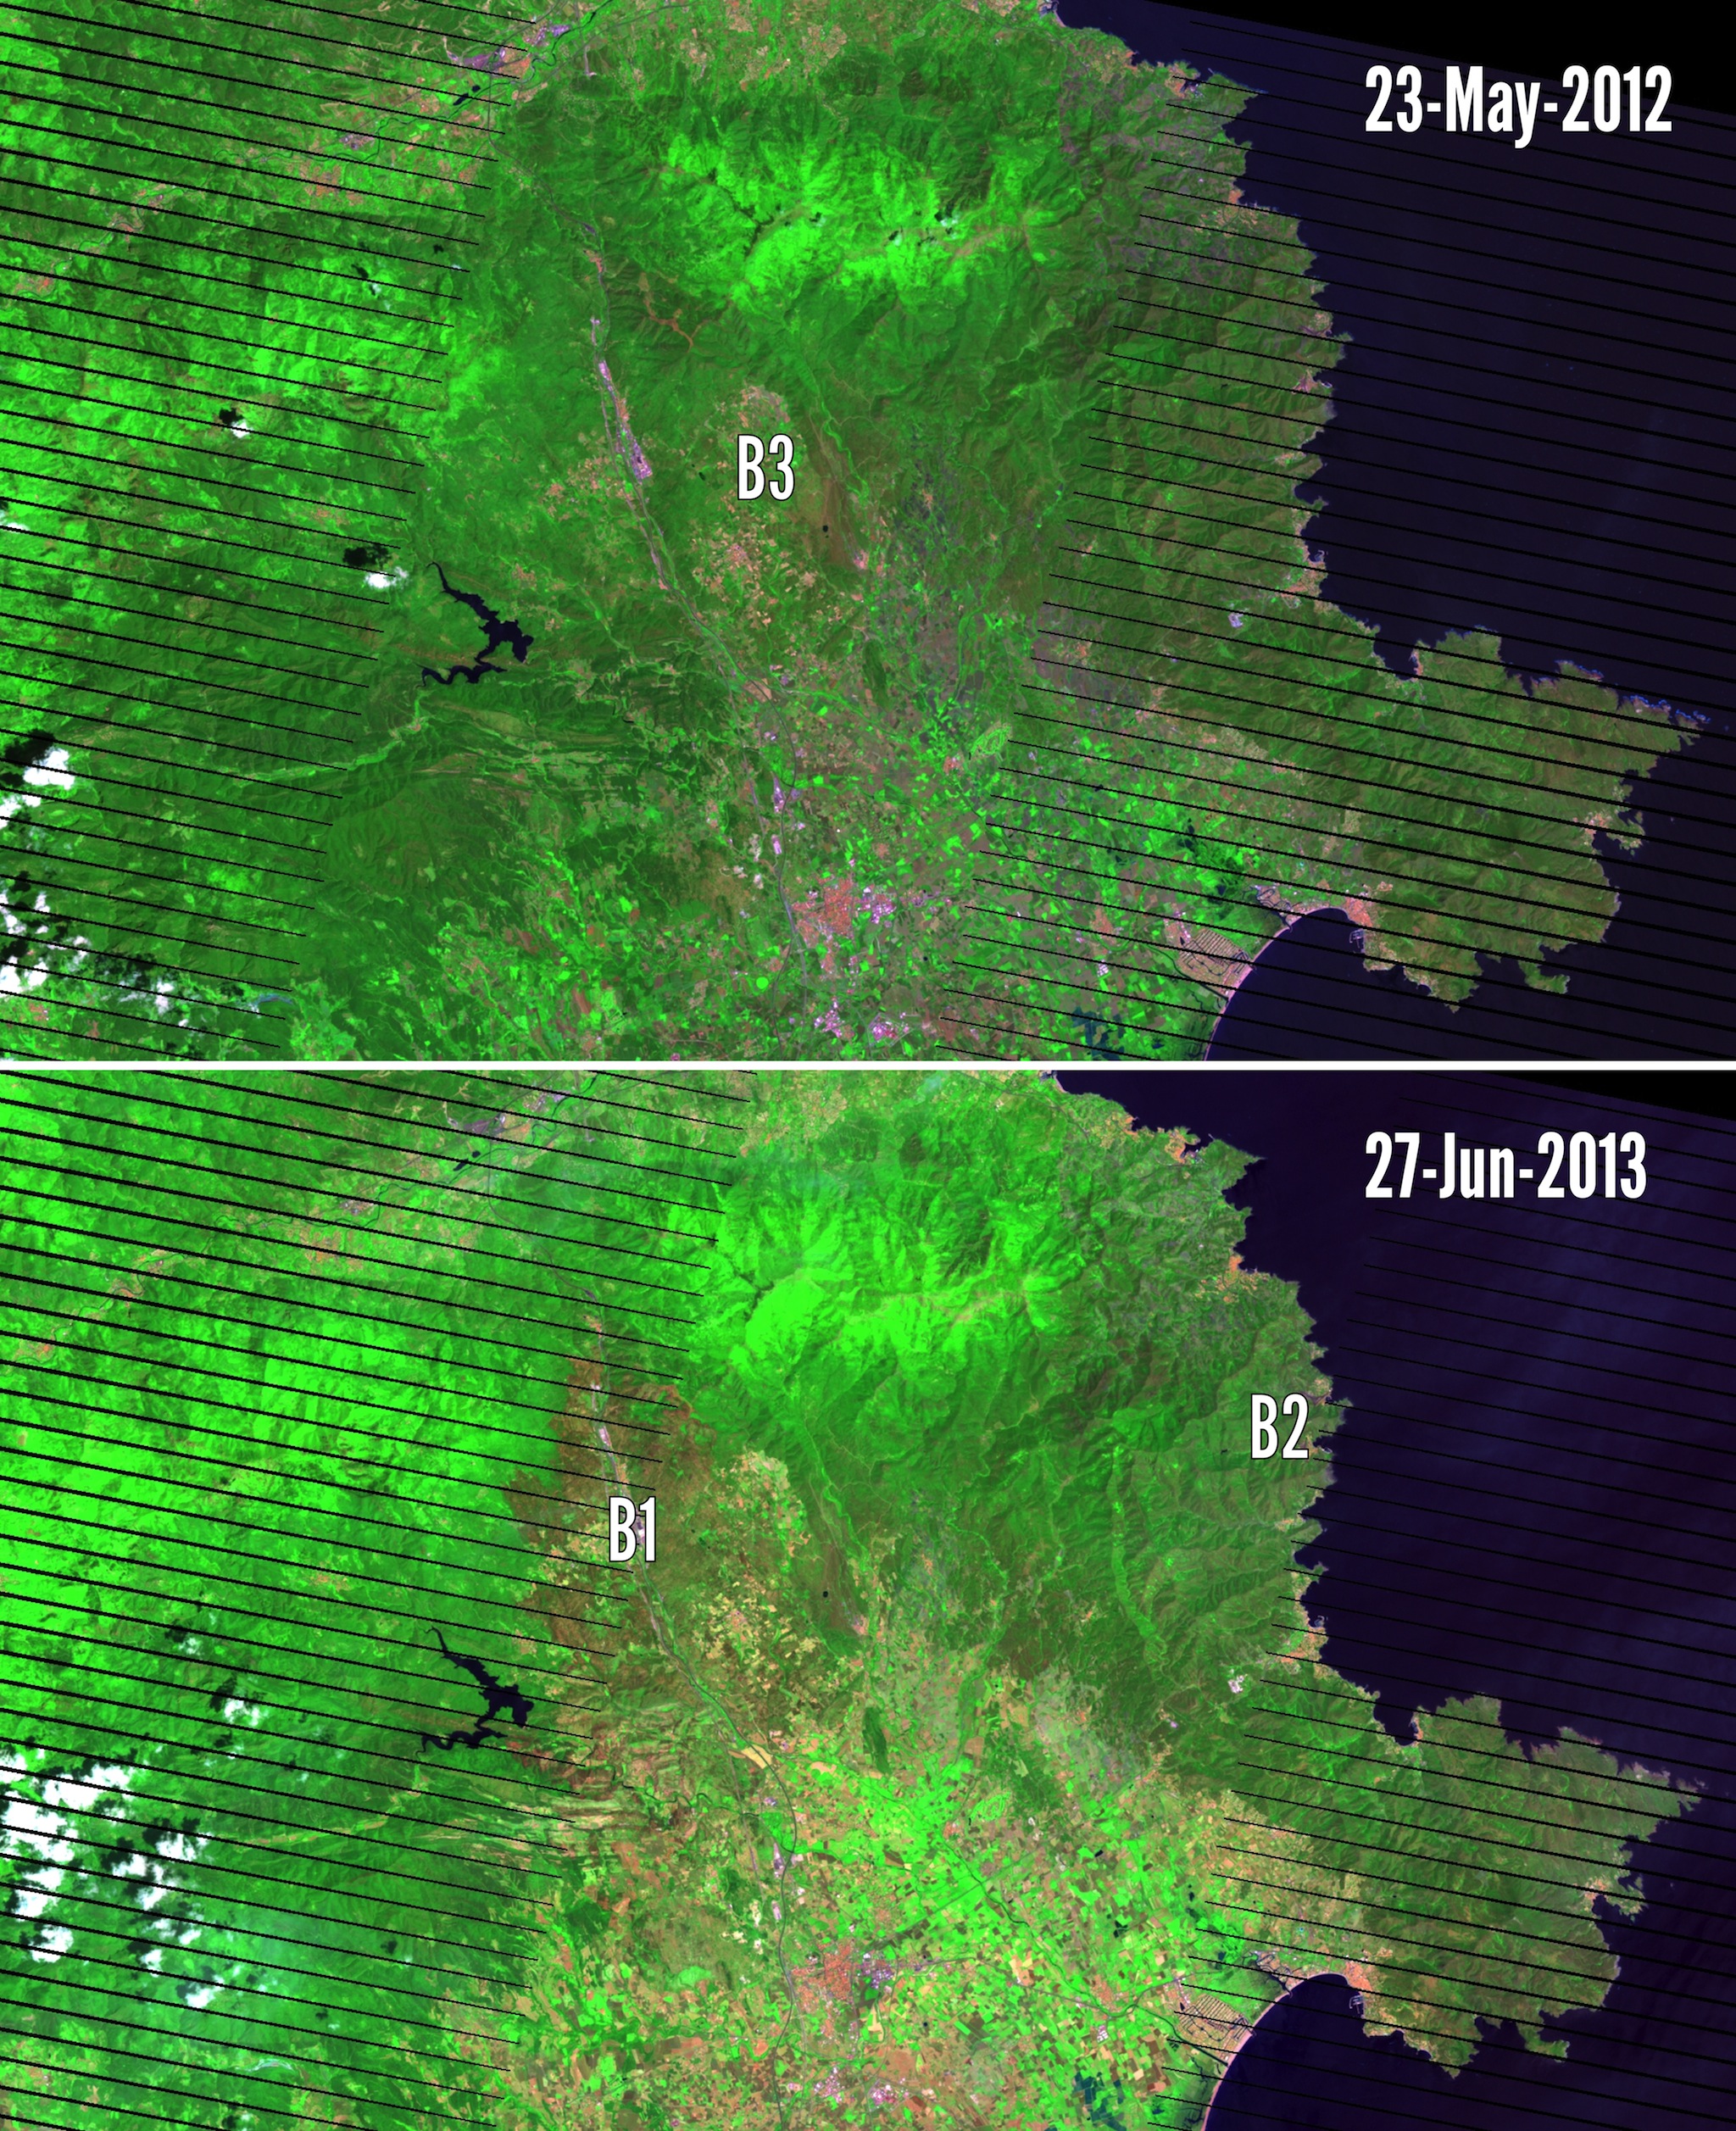
Extended assessment false color prefire (top) and postfire (bottom) images
The major fire in B1 shows a reddish tonality consequence of a larger emission from band 7, which responds to drying and to some non-vegetated characteristics. Nonetheless, the intensity of the burned area is considerably lower than that of the post-fire image in the initial assessment just after the fire (see it here, bottom image).
After the process of calculation of the differential Normalized Burn Ratio $(dNBR)$, the same perimeter as with the initial assessment was applied to classify the image into seven classes depending on burn intensity from enhanced regrowth to high severity.
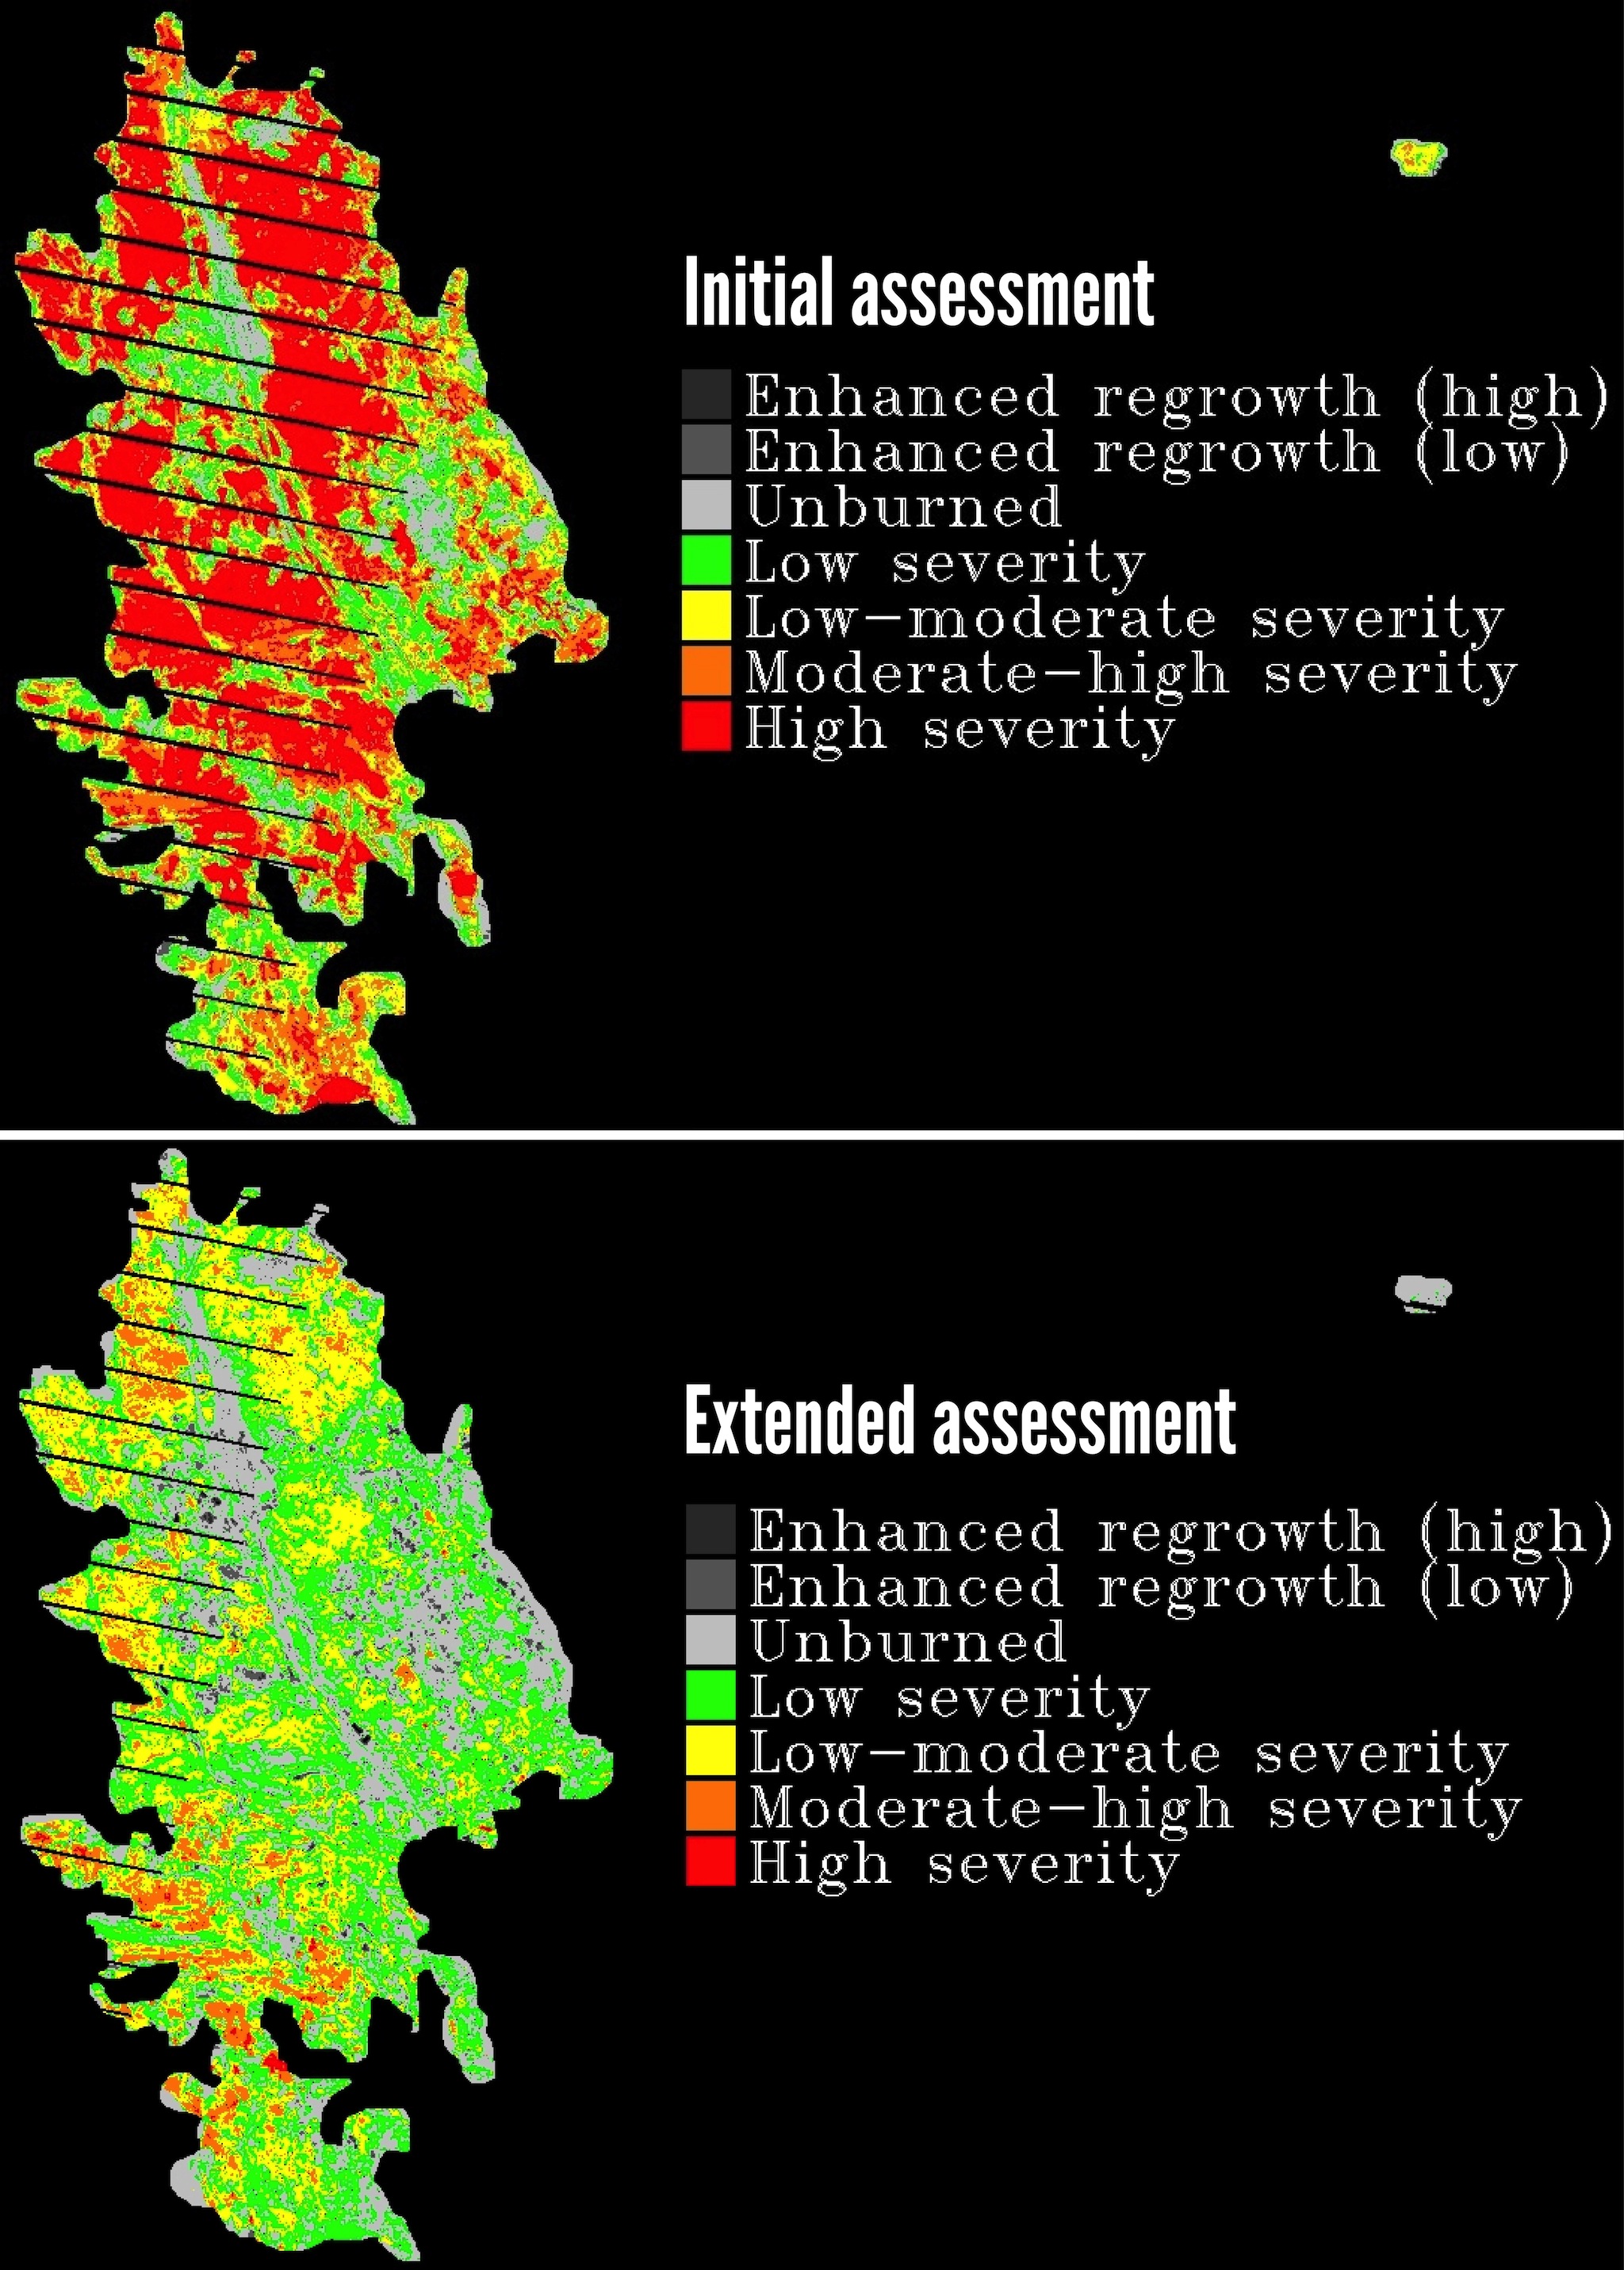
Initial and extended assessment $dNBR$ burn severity classification
The extended assessment presents the following distribution of burn severity across the different classes:
- Enhanced regrowth (high+low): 288 hectares
- Unburned: 3,714 hectares
- Low severity: 4,522 hectares
- Low-moderate severity: 3,688 hectares
- Moderate-high severity: 1,077 hectares
- High severity: 44 hectares
Total: 12,754 hectares (9,331 hectares burned)
This means 19% less of hectares burned with respect to the initial assessment analysis, and almost no hectares showing high fire severity. Despite a trend of potential regrowth, the numbers may be somehow difficult to understand. Here the same class thresholds have been used for both analysis, which plays in favour of overestimating regrowth in the extended assessment totals, especially when the study is carried out during the growing season. Alternatively, performing the initial assessment just after the fire tends to indicate considerably higher severity. In this sense, it’s not easy to choose the thresholds to balance all the effects that take place in the images timing and seasonality. As already pointed out before in my first post, ground confirmation of the burn will help in determining this thresholds. Further evaluation of the imagery together with ground observations will also provide information on which kind of vegetation is regrowing faster (for example grasslands or shrubs).
This post closes the analysis of La Jonquera fires in 2012 using Landsat 7 data, which is only a brief study with a few imagery; but many other in-depth studies are carried out during wildfires burns evaluation. Certainly, the potential of synergies between satellite observations and ground sampling is key in learning about the effects of burns in the local vegetation and species, and how to mitigate its consequences.