Blog
The Earth Observation Blog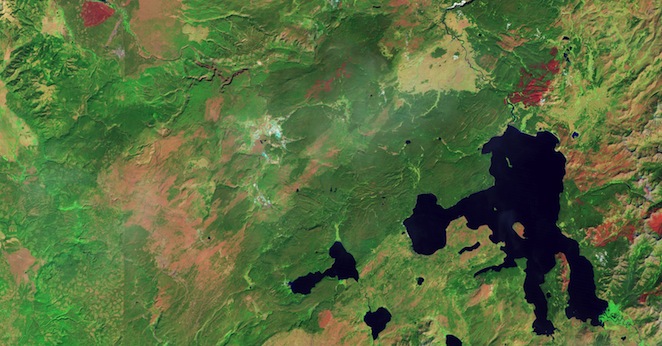
Landsat and the Spain summer 2012 wildfires (I)
Sadly, as the summer season begins news from occurring fires generously populate the headlines of many of our local newspapers. Certainly the increase in the number of frequent wildfires is a symptom of the Earth’s global warming, and it’s absolutely striking that 90% of biomass burning is human instigated.
Fires at diverse locations and ecosystems burn different depending on the type and structure of its biomass and moisture content. But especially at northern latitudes, where the temperature is rising every year, the fires at Boreal forests burn the hottest and contribute with the most pollutants per unit area burned (such as carbon monoxide). It’s not the case for instance of small and dry grasses in savannahs, in which mainly carbon dioxide is produced in a near-complete combustion process. Thus, in turn fires may further contribute to global warming and compromise air quality. Not only that, but the socio-economic impact in terms of terrain rehabilitation, property loss and human causality are also important factors to consider as a result of fires.
Quick reaction to the effects of fires is of ultimate importance to identify, evaluate and quantify the fire effects over large burned areas. Decisions undertaken soon on the short-term severity of burns allow for a better understanding of long-term effects. The strategy shaped for the biomass recovery may be therefore accurately established. However, burn severity is difficult to estimate and depends on the scale we are looking at, the particular means available to measure it, or the initial objectives, as we may be interested only in a particular species.
An interesting way to evaluate burn severity in an aggregate effect over large areas is to use Landsat 7 (or Landsat 8 now) 30 meter resolution data, which provides near global coverage of multispectral data every 16 days, a suitable spatial resolution for broad-area coverage. Complementing the Landsat images with ground data provides meaningful information to contrast and understand the results obtained.
One of the most popular indexes used in burn severity assessment is the Normalized Burn Ratio $(NBR)$, which is defined as the combination of two Landsat bands:
$$NBR=\frac{R_4-R_7}{R_4+R_7},$$
with $R_4$ and $R_7$ the reflectance values at the sensor for band 4 (near-infrared) and band 7 (short-wave infrared), respectively. Band 4 naturally reacts positively to leaf area and plant productivity, whereas band 7 responds to drying and to some non-vegetated characteristics. These bands are applicable to Landsat 5 TM (decommissioned) and Landsat 7 ETM+ instruments; in Landsat 8 the bands are narrower and the near-infrared band 4 in TM/ETM+ has been renamed to band 5 in OLI (read this post for more information on Landsat sensors). In this text the near-infrared band 4 refers to the Landsat 7 band.
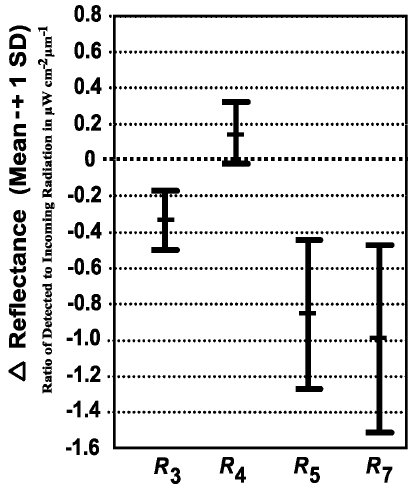
Landsat TM/ETM+ band response to burns (USDA Forest Service)
The difference of the two bands enhances the effects of burns in vegetation, yielding the following cases:
- Band 4 $>$ Band 7 $(NBR>0)$ for most vegetated areas that are productive
- Band 4 $\approx$ Band 7 $(NBR\approx 0)$ for non-productive vegetation, dry soils, rocks, or clouds
- Band 4 $<$ Band 7 $(NBR<0)$ for large water stress and burn traces in vegetation
Since the difference of bands in $NBR$ is scaled by their sum, implicitly the overall brightness across the bands is normalized, and topographic effects within every scene are removed. The measure of environmental change between an unburned and a burned area after a fire may be obtained just by subtracting the $NBR$ obtained after burning from the one before burning: $$dNBR=NBR_{prefire}-NBR_{postfire}$$
This assumes unburned terrain is similar between both dates compared in terms of phenology and moisture. $dNBR$ is near zero for background unburned areas, whereas strong positive or negative values indicate a decay or an enhancement of vegetation productivity, respectively. The former is usual in forests and shrub areas where fire effects have a long term impact on biomass productivity. On the contrary, when burn severity is light and affects to herbaceous terrains the release of nutrients after fire may trigger vegetation vigor.
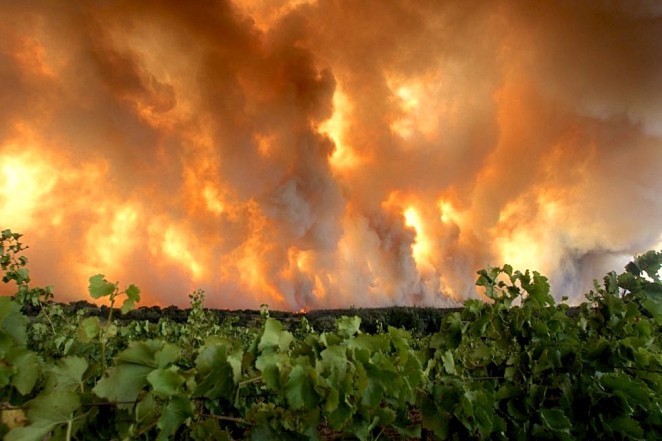
During the summer 2012, two fires started at the locations of La Jonquera and Portbou, in the very north-eastern region of Spain near France (BBC News). That summer had been the driest of the latest 40 years in Catalonia, and the forests weren’t in a very good condition due to the heavy snowfalls two years before. The fires started the 22nd July and were considered extinguished the 30th of that month. More than 13,000 hectares of typical Mediterranean vegetation (holm oak and pine forests, herbaceous fields and shrubs) burned easily, and unfortunately four people died during the events.
The fire near La Jonquera, Catalonia, Spain
A first look at the burned area from ‘La Jonquera’ wildfires may be carried out by producing a false color image with ETM+ data from the 11th August 2012, just some days after the fire. It’s important that given the definition of $dNBR$ the prefire and postfire images represent similar surface features. Even if unburned landscapes tend to dynamically change over time, ideally both images will represent moisture content and phenology as similarly as possible. This is usually related to the growing seasons, and may be analyzed in a RGB composite of bands 7, 4 and 2, respectively.
Two dates have been selected as representative for the initial assessment of the burn: 11th Agust 2012 as the postfire image (some days after the fire extinction) and 9th August 2012 as the prefire one (1 year before the fire).
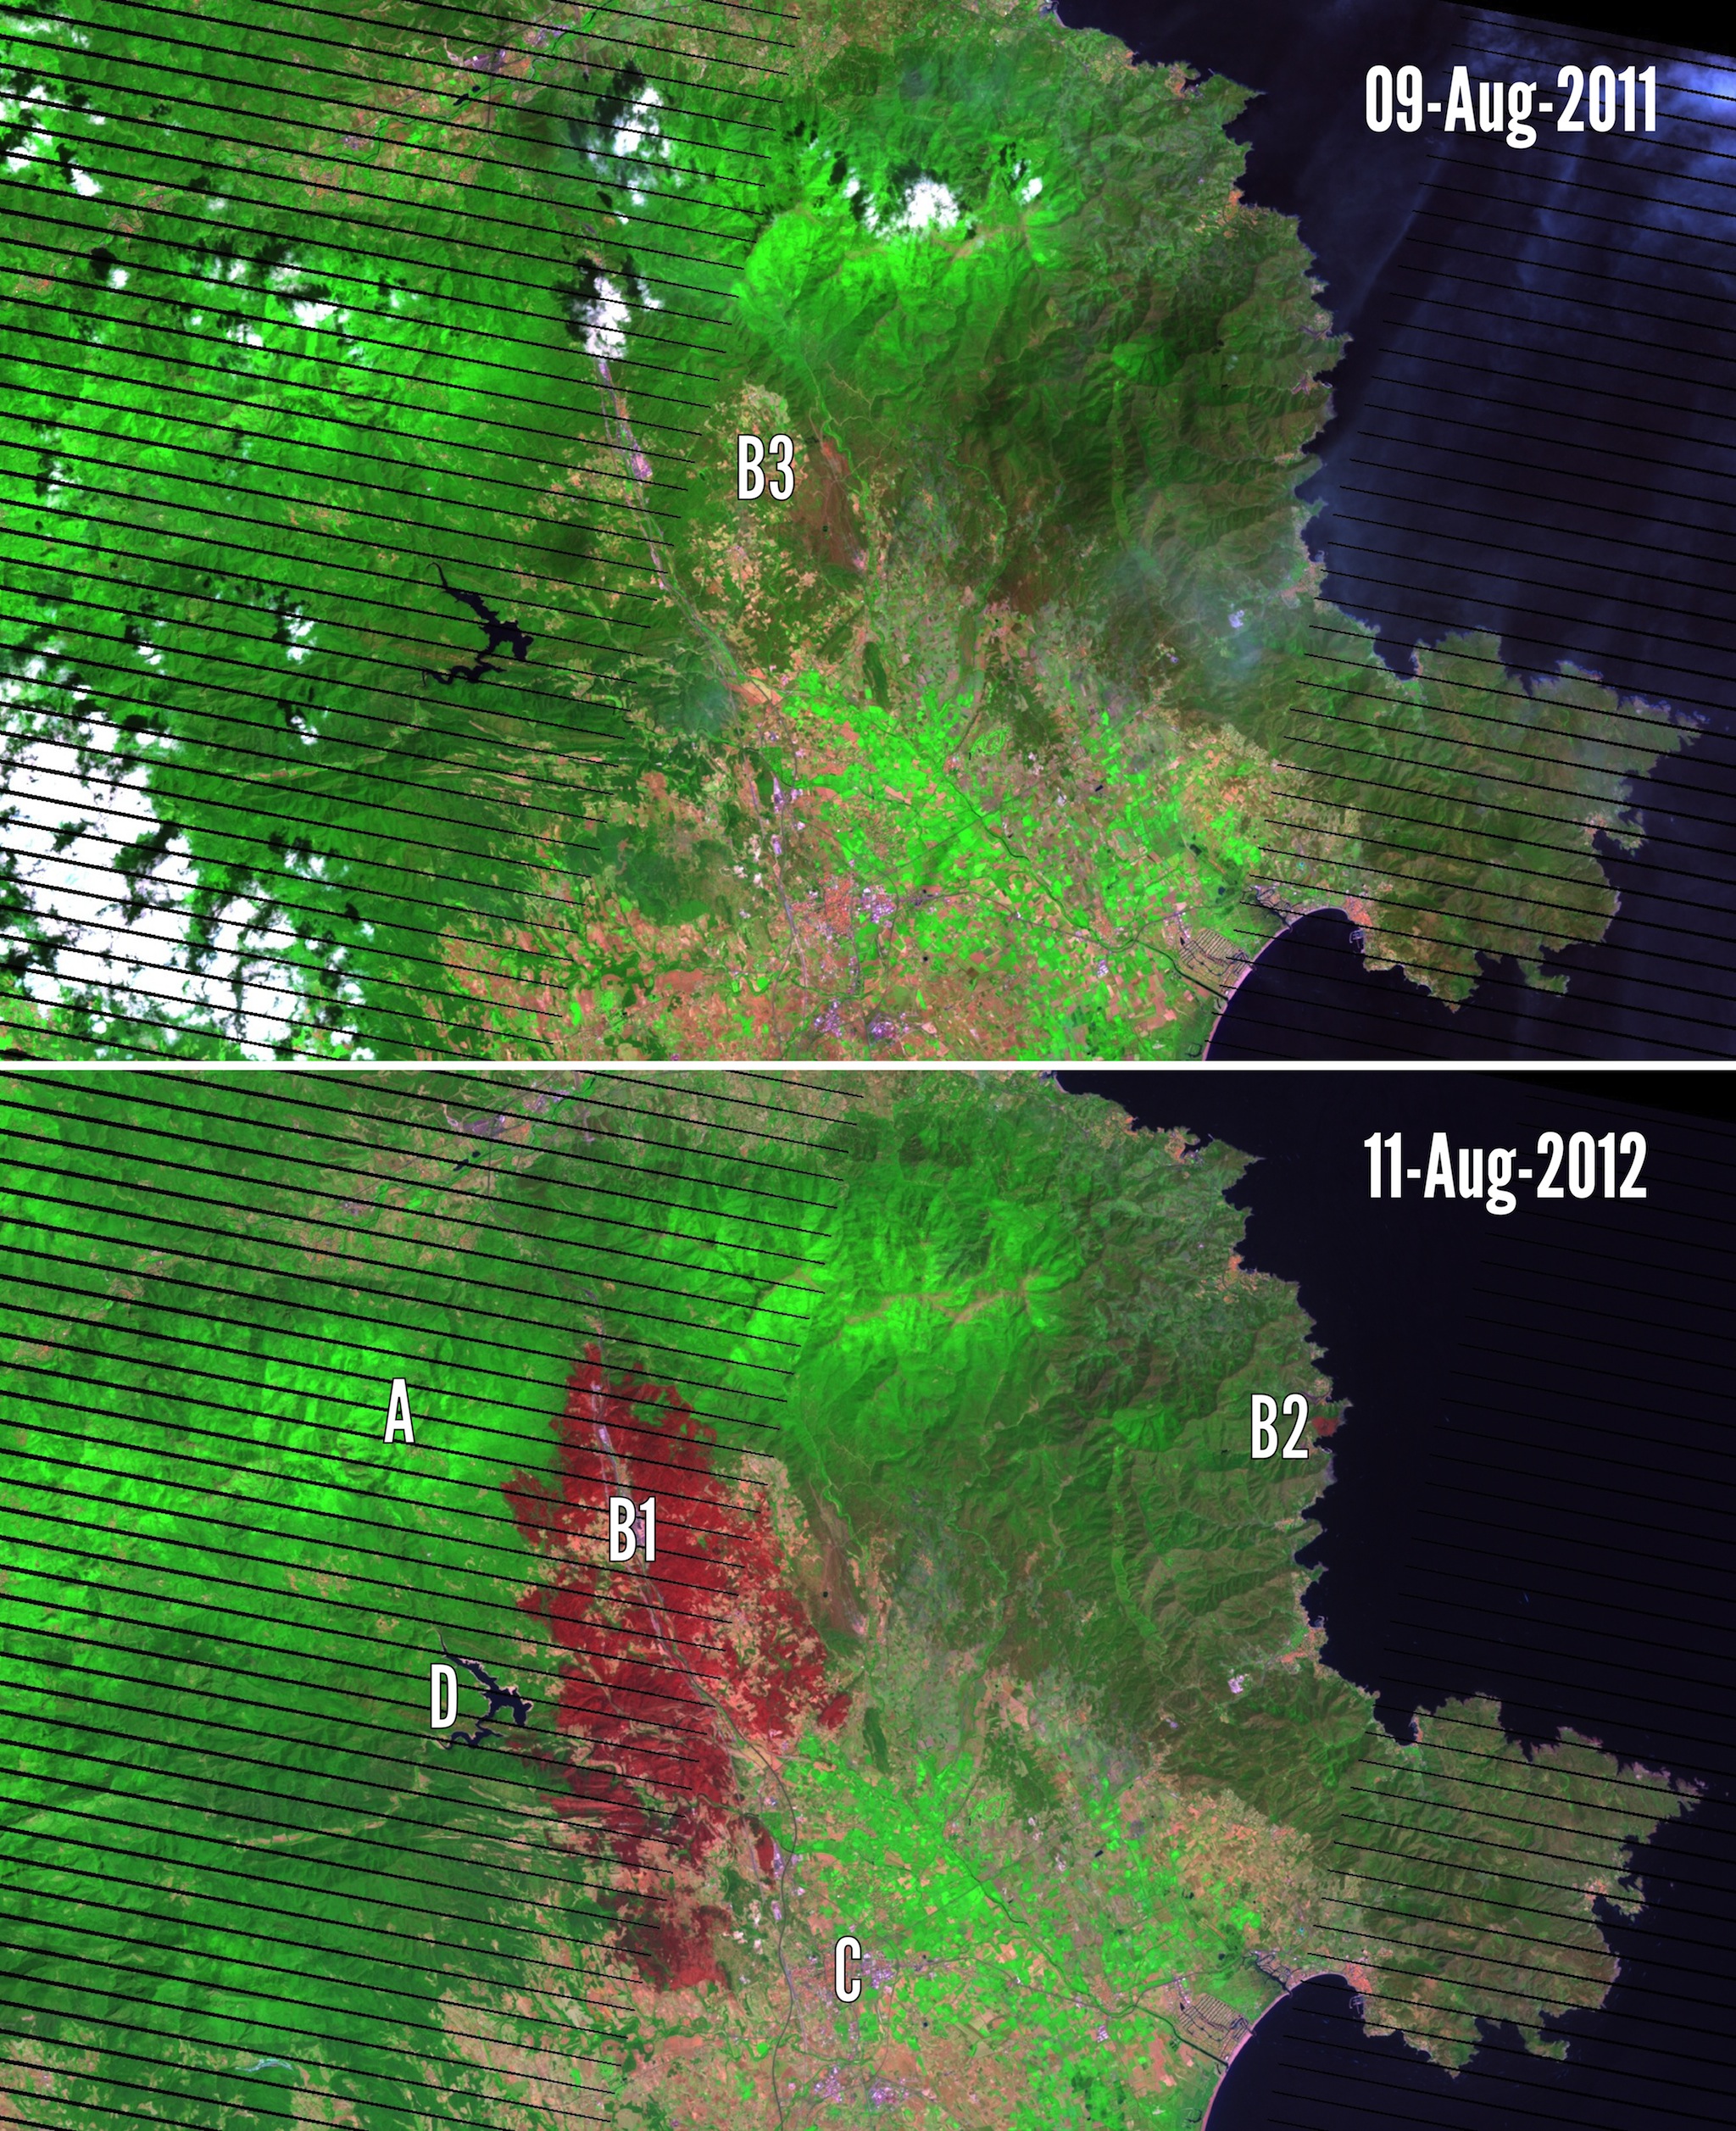
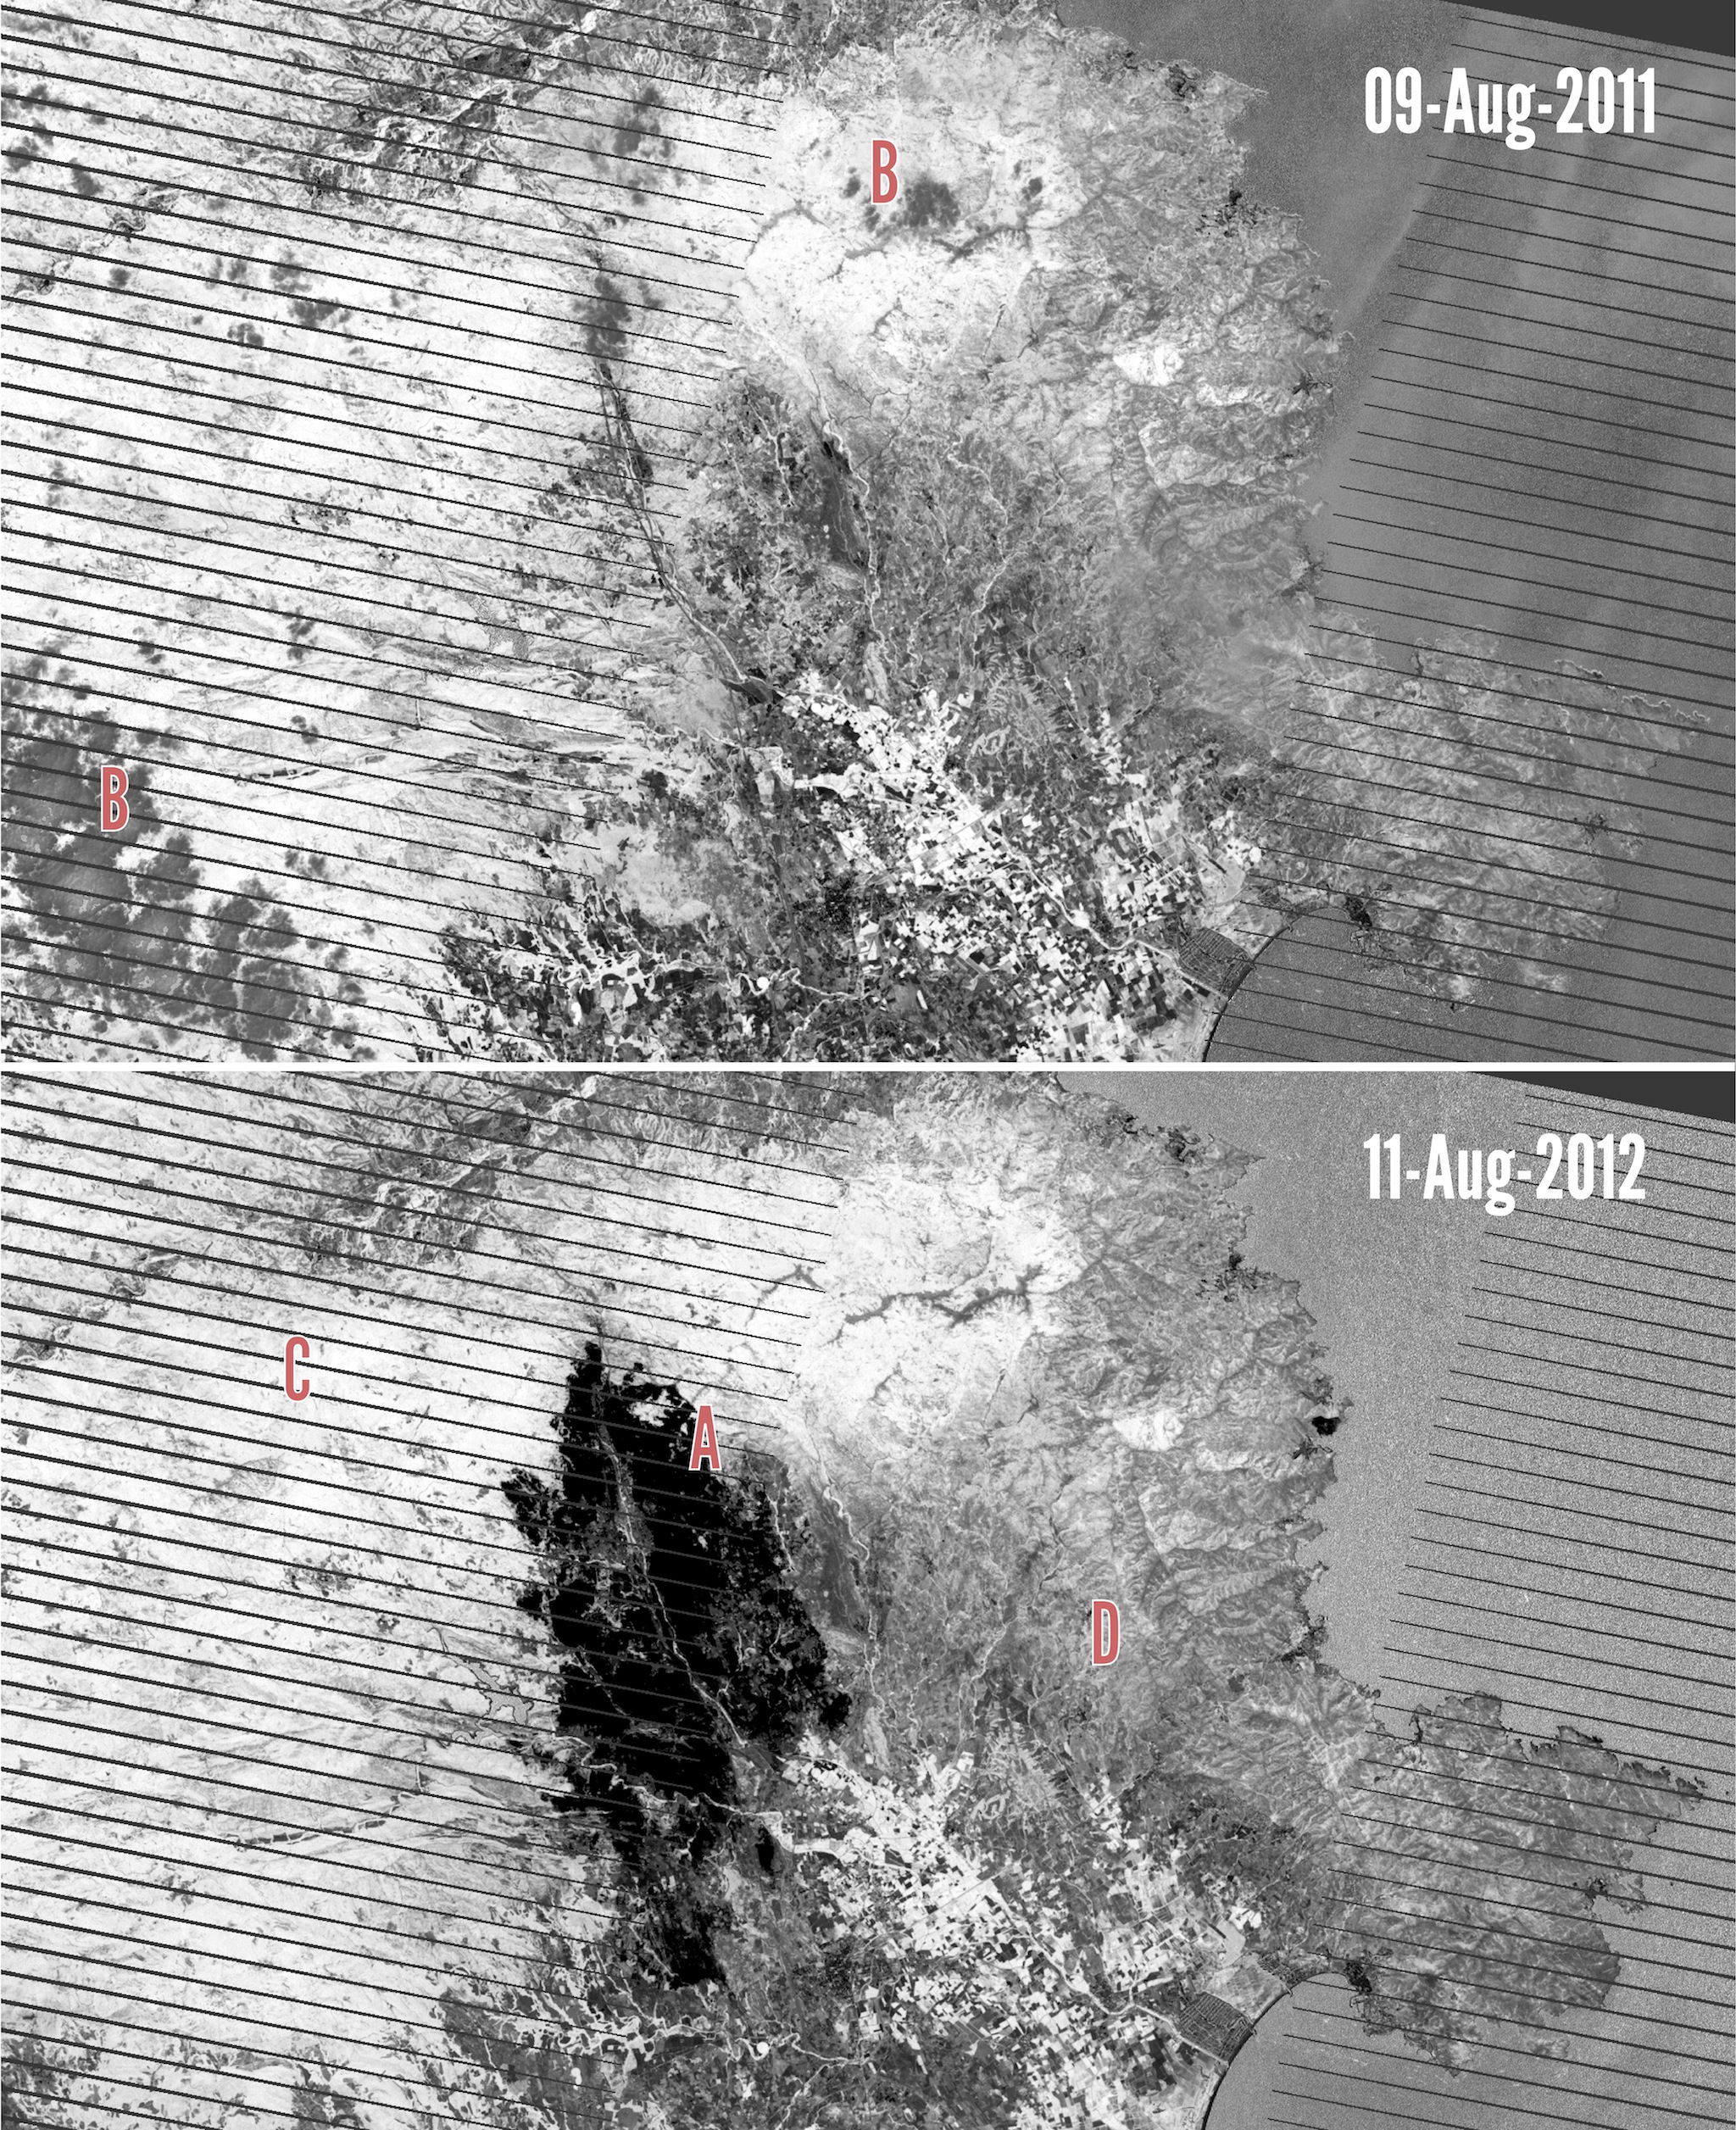
Initial assessment false color prefire (top) and postfire (bottom) images
The Scan-Line-Corrector problems are clearly shown as black strips in the images. With this band combination healthy vegetation shows bright green (A), and bare soil areas pink. Oranges and browns represent sparsely vegetated areas whereas urban areas are showed in magenta tones (C). The burned areas instead are clearly displayed in red in the postfire image due to the large emission at band 7. The recent large fire at La Jonquera stands out clearly (B1), while the Portbout fire (B2) is showed much smaller. Also interesting are the rests of older fires like the one in B3, that burned near Sant Climent Sescebes in 2006. Water bodies are dark blue (D), and light grey lines represent roads and paved areas. Apart from the cloudy regions in the prefire scene, both images are comparable in terms of vegetation growth status, and suitable for its $NBR$ comparison. Now with the same two scenes the $NBR$ calculation may be performed obtaining the following images:
Initial assessment prefire (top) and postfire (bottom) $NBR$
The strong negative values in (A) clearly suggest severe water stress and consequences of burns, whereas large positive bright values like (C) represent vegetated areas that are productive. Parts of the landscape which are less productive (D) display lower positive values instead. All mid-gray values in the picture mean $NBR$ near zero, as with non-productive vegetation and drier soils, and clouds (B). The difference between the two images produces the $dNBR$, which is scaled by 1000 and evaluated specifically within the burn perimeter as shown in the image below:
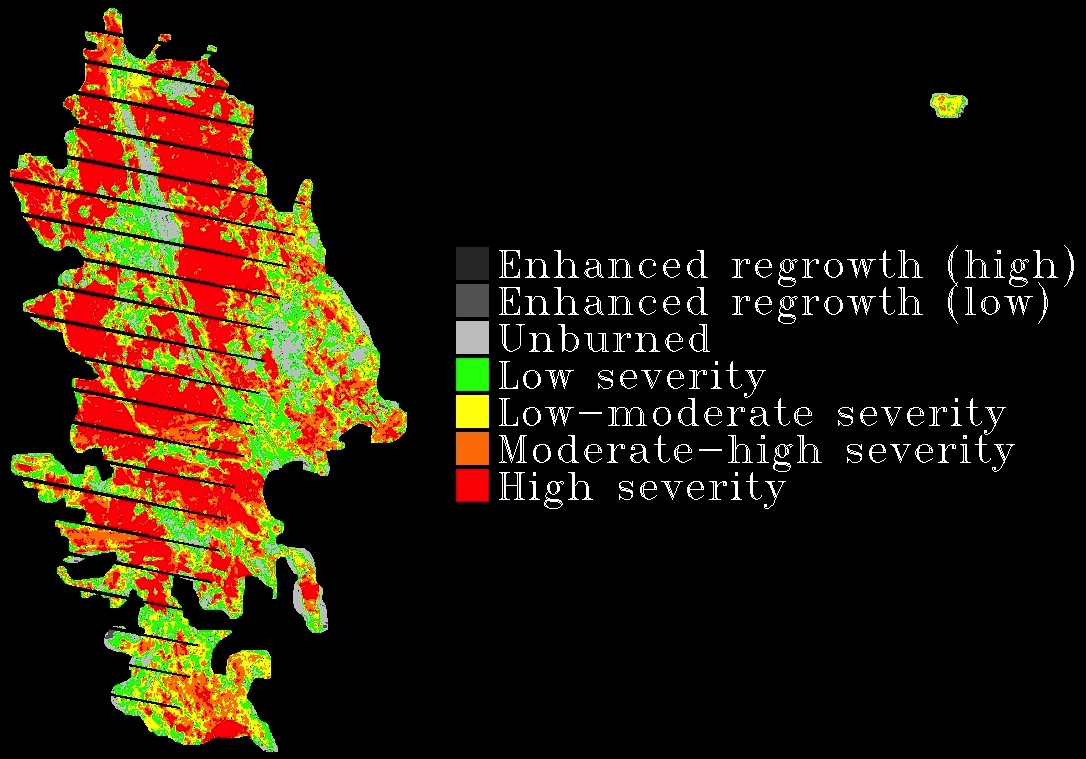
Initial assessment $dNBR$ severity classification
The severity of the burn has been divided into seven classes ranging from enhanced regrowth (low values of $dNBR$ below -100) to high severity (larger than +660). The specific interval values of each class depend on the seasonality and timing, and a fine tuning may be achieved with ground data and further image processing. Unburned areas are shown in light gray in the image, with values -100 to +100 typically near zero, meaning no change between the prefire and postfire images. The next four classes range from +100 to +1300 and define the severity of the burn from low to high. The area burned in each of the classes within the defined perimeter is:
- Enhanced regrowth (high+low): 24 hectares
- Unburned: 1,207 hectares
- Low severity: 2,103 hectares
- Low-moderate severity: 2,242 hectares
- Moderate-high severity: 2,796 hectares
- High severity: 4,382 hectares
Total: 12,754 hectares (11,523 hectares burned)
The total number approximates that of the official news reports, but a final number should be based on a further fine processing. It’s important to note as well that the use of imagery close to the actual fire, as it is the case, may overestimate the real severity of the burn. A more representative assessment of the actual severity (extended assessment) is usually done using images from the following growing season after the fire, compared to a scene of the prefire growing epoch. By doing so, burned vegetation has had some time to recover and to show a response from the initial severity. On the other side, parts of the vegetation green after the fire may have died in the next growing season.
I tried to get some Landsat passes from this year’s growing season around the months of May-June, but I feel that given the outstanding amount of rain this year I’ll have to wait a bit to be able to compare them to last year’s season. A nice starting point, though, for a following post. But all in all I believe that the potential of remote sensing for fire assessment is clearly proven; and that’s only an introduction, more is to come!
I would like to appreciate here the great infrastructure of the US Geological Survey (USGS) in processing the Landsat surface reflectance data and make them freely available to everyone, together with the nice USDA Forest Service reports. That’s the way!